
Innovation snapshot
The REMEDIES Impact Evaluation Dashboard is the project’s central platform for measuring and communicating impact against marine plastic pollution. It brings together monitoring, clean-up and prevention data from across the Mediterranean and presents it through clear, interactive visualisations, so that partners, policymakers and citizens can see what is working, where, and how successful approaches can be scaled.
Related REMEDIES pillars: Detection & Monitoring, Collection & Valorisation, Prevention & Zero-Waste Solutions (cross-cutting)
Partner(s)/Owner(s): CIBOS Innovation
Made for: Project partners and demo-site teams, policymakers and public authorities, marine researchers, environmental NGOs, community organisations and citizen scientists
Technology maturity: Full deployment across all REMEDIES demo sites by December 2026
Commercial relevance: Designed for organisations and authorities that need a single, standardised platform to measure, compare and communicate marine-litter reduction across sites, technologies and campaigns
Watch the Tutorial Video/Presentation video about the Dashboard:
The challenge it addresses
Measuring the real impact of marine-litter action is difficult when data is scattered across formats, teams and tools. Fragmented evidence weakens decision-making, policy design, resource allocation and the case for scaling what works.
- Fragmented data: monitoring, clean-up and technology data are gathered in different places and formats, making a project-wide picture hard to assemble.
- Limited comparability: without a common platform, results cannot be compared consistently across sites, campaigns and technologies.
- From data to decisions: stakeholders need clear, quantifiable evidence to inform policy, funding and prevention strategies.
The solution
The Impact Evaluation Dashboard consolidates data from every REMEDIES activity, beach, seabed and riverine litter monitoring (macro and microplastics), clean-up operations, aerial and underwater drone surveys, and GPS buoys tracking pollution hotspots, together with work-package outputs such as optimized prevention measures, cost–benefit and sustainability analysis and life-cycle assessment.
It sits on top of the REMEDIES Shoreline ML App and the REMEDIES Data Portal and aligns with European data standards such as EMODnet. From these sources it produces interactive maps, metric cards and comparative charts that let users measure, compare and communicate progress in reducing marine litter over time and across locations.
Unique value proposition
- Multi-source, up-to-date integration: combines clean-ups, drone and underwater monitoring, buoys and laboratory results in a single, current view.
- Interactive, customizable visualization: maps, metric cards and comparative donut and bar charts that users filter to the metrics that matter to them.
- Built-in impact metrics: turning raw litter cunts into environmental, social and economic indicators for REMEDIES technologies.
- Scalability and replicability insight: highlights successful activations that can be transferred to new sites and regions.
- Standards-based and interoperable: aligned with EMODnet
Technical characteristics
- Front-end web application built with React (create-react-app), delivering interactive maps, metric cards and comparative charts.
- Data served through REST APIs covering organizations, clean-ups, devices, monitoring (EMODnet), litter, beaches, polymer types, and dashboard-widget and statistics endpoints.
- Integration with the REMEDIES Data Portal and Shoreline ML App as primary data sources.
- EMODnet-aligned data exchange and validation, enabling comparison of project data with standardized European datasets.
- Role-Based Access Control and data security / GDPR by design.
- Prepared for integration with EDITO, the European Digital Twin of the Ocean.
- Alpha version available online, updated iteratively as project data is validated.
The dashboard in practice — main views
The dashboard organizes project data into a set of focused views, so different users can quickly reach what they need, from a project-wide snapshot to site-, campaign- and technology-level detail.
- Total Metrics Overview: headline project KPIs at a glance — litter collected, events, participants and material breakdown.
- Map Overview: litter and activity mapped across the REMEDIES demo sites and pollution hotspots.
- Campaign Overview: participation and litter collected per clean-up / event and over time.
- Environmental Impacts: environmental performance of REMEDIES technologies, such as the river-cleaning system.
- Environmental & Economic Impacts: combined environmental, social and economic indicators for prevention / zero-waste solutions.
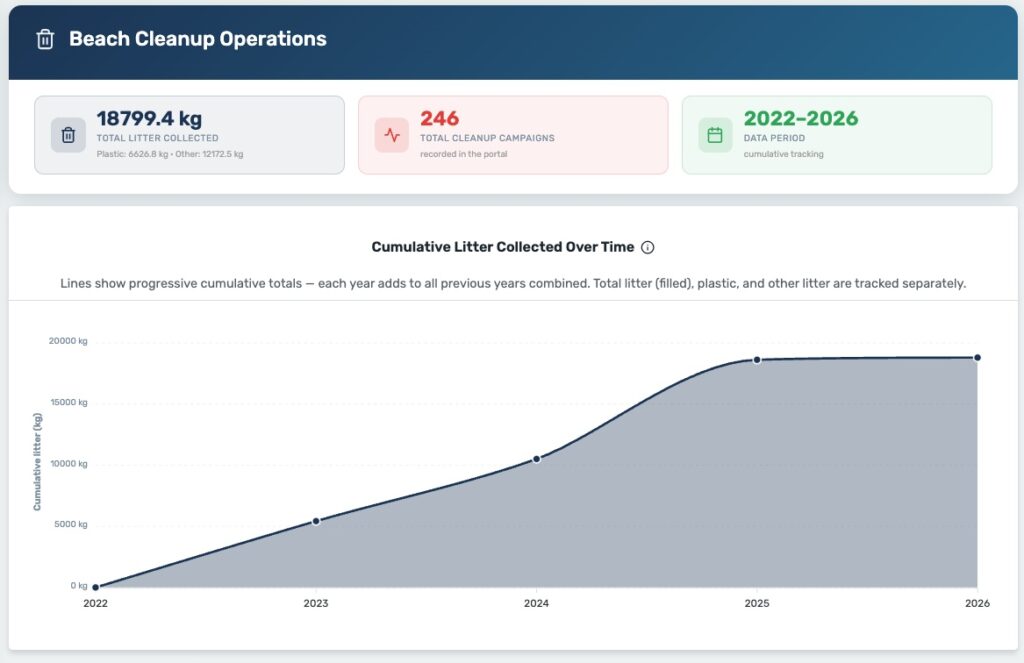 Aggregated Beach Cleanup Data
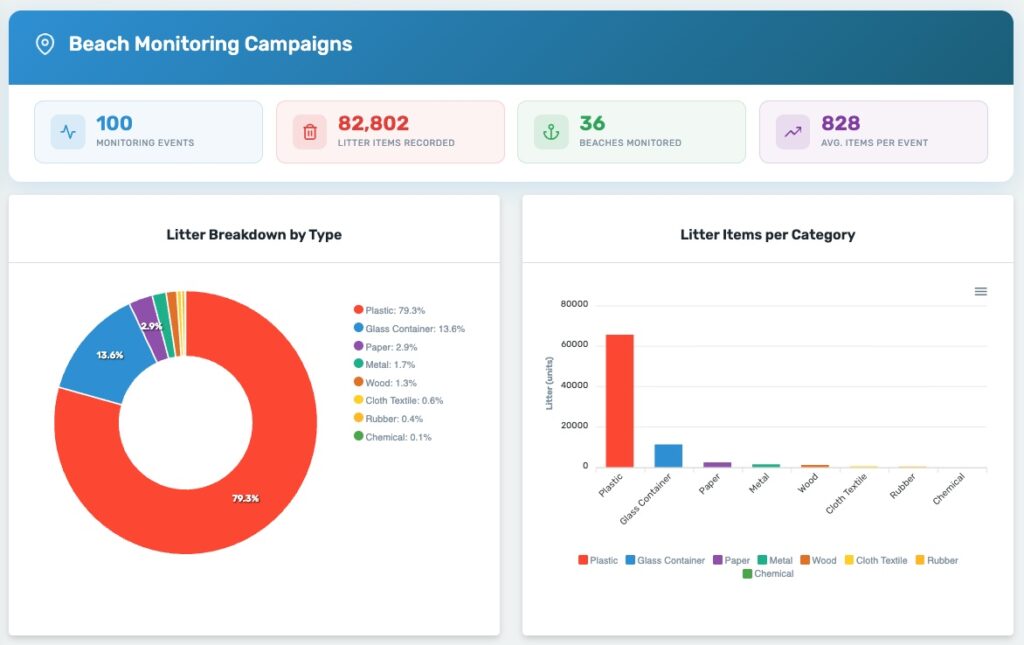 Aggregated Beach Monitoring Cleanup Data
Who can use it
- Project partners and demo-site teams: a shared, traceable view of monitoring and clean-up results for day-to-day reporting.
- Policymakers and public authorities: quantifiable evidence to support regulation, prevention planning and funding decisions.
- Researchers and academia: consolidated, comparable data for trend analysis and publication.
- Environmental NGOs and community organisations: accessible, visual data for campaigns and engagement.
- Citizen scientists: a transparent way to see how their contributions add up to project impact.
- Coastal, water and river-basin authorities: site-level insight to prioritise interventions.
Deployment and exploitation pathway 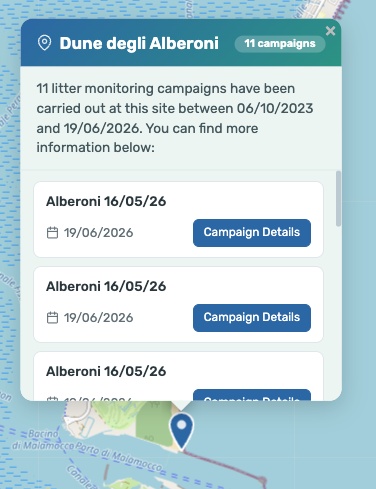
The dashboard is positioned as a scalable platform for measuring and communicating marine-litter impact. Its exploitation pathway combines progressive data integration, adoption and capacity building, continuous improvement and replication.
- Progressive integration of validated data from all demo sites and work packages.
- Adoption and training activities to grow active users towards the project KPI.
- Continuous UX and feature improvement based on stakeholder feedback.
- Replication as a reusable impact-evaluation template beyond REMEDIES, aligned with European initiatives such as EMODnet and EDITO.
Discover more and contact
CIB (CIBOS): https://cibos.gr/
Live dashboard: https://dashboard-remedies.mycibos.eu/
Contact for further information: info@cibos.gr